January 6, 2014
London, England
[Editor’s Note: Tim Price, Director of Investment at PFP Wealth Management and frequent Sovereign Man contributor is filling in for Simon today.]
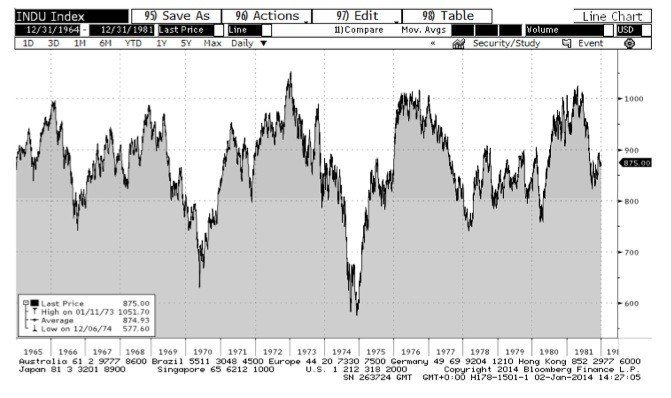
On December 31st, 1964, the Dow Jones Industrial Average stood at 874. On December 31st, 1981, it stood at 875. In Buffett’s words, “I’m known as a long term investor and a patient guy, but that is not my idea of a big move.”
To see in stark black and white how the US stock market could spend 17 years going nowhere– even when the GDP of the US rose by 370% and Fortune 500 company sales went up by a factor of six times during the same period– the price chart for the Dow is shown below.
So the US stock market suffered a Japan-style lost decade, and then some. Back to Buffett, again:
“To understand why that happened, we need first to look at one of the two important variables that affect investment results: interest rates.
“These act on financial valuations the way gravity acts on matter: The higher the rate, the greater the downward pull. That’s because the rates of return that investors need from any kind of investment are directly tied to the risk-free rate that they can earn from government securities.
“So if the government rate rises, the prices of all other investments must adjust downward, to a level that brings their expected rates of return into line.
“In the 1964-81 period, there was a tremendous increase in the rates on long-term government bonds, which moved from just over 4% at year-end 1964 to more than 15% by late 1981. That rise in rates had a huge depressing effect on the value of all investments, but the one we noticed, of course, was the price of equities.
“So there–in that tripling of the gravitational pull of interest rates- -lies the major explanation of why tremendous growth in the economy was accompanied by a stock market going nowhere.”
So how you feel about asset allocation this year should largely be a function of how you feel about interest rates.
And if you fear that interest rates are more likely to rise– triggered, perhaps, by a combination of Fed tapering and general weariness / revulsion at the manipulation of so many financial assets– then you should perhaps question your commitment to western equity markets as well as to bonds.
As Buffett wrote in a 1999 article in Fortune magazine, “Secular equity bull markets occur when long-term rates are dropping… and secular bears occur when rates are rising.” This is hardly rocket science.
Of course, 2014 could be yet another year in which equity markets rise further, driven by hopes and expectations of still more QE. But that’s not a bet we’re entirely comfortable making.
Since we’re primarily attracted by valuations and not by momentum, we’re now fishing for equities in a clearly demarcated pool (Asia and Japan– because that’s where values are most compelling).
We are not interested in most western markets because the value isn’t visible to us and the underlying growth (fundamentals, anybody?) looks pathetic.
And our monetary authorities have showered financial markets with kerosene by ensuring that the conventional ‘risk-free’ alternative to equities (i.e. government debt) is anything but.
Yet our exposure to ‘alternative’ assets, primarily precious metals, proved variously problematic last year.
2013 was the year that the mainstream financial media went aggressively anti-gold, and in his magisterial (and deeply witty) 2013 Year In Review, Cornell chemistry professor and economic agent provocateur David Collum cites three pertinent quotations from the New York Times:
“There is simply nothing in the economic picture today to cause a rush into gold. The technical damage caused by the decline is enormous and it cannot be erased quickly. Avoid gold and gold stocks”;
“Two years ago gold bugs ran wild as the price of gold rose nearly six times. But since cresting two years ago it has steadily declined, almost by half, putting the gold bugs in flight. The most recent advisory from a leading Wall Street firm suggests that the price will continue to drift downward, and may ultimately settle 40% below current levels”;
“The fear that dominated two years ago has largely vanished, replaced by a recovery that has turned the gold speculators’ dreams into a nightmare.”
But as Collum also points out, these quotes are from 1976, when the spot price of gold fell from $200 to $100 an ounce. Thereafter, gold rose from $100 to $850.
Why do we continue to keep the faith with gold (and silver)? We can encapsulate the argument in one statistic.
Last year, the US Federal Reserve enjoyed its 100th anniversary, having been founded in a blaze of secrecy in 1913. By 2007, the Fed’s balance sheet had grown to $800 billion.
Under its current QE programme (which may or may not get tapered according to the Fed’s current intentions), the Fed is printing $1 trillion a year.
To put it another way, the Fed is printing roughly 100 years’ worth of money every 12 months. (Now that’s inflation.)
Conjuring up a similar amount of gold from thin air is not so easy.


